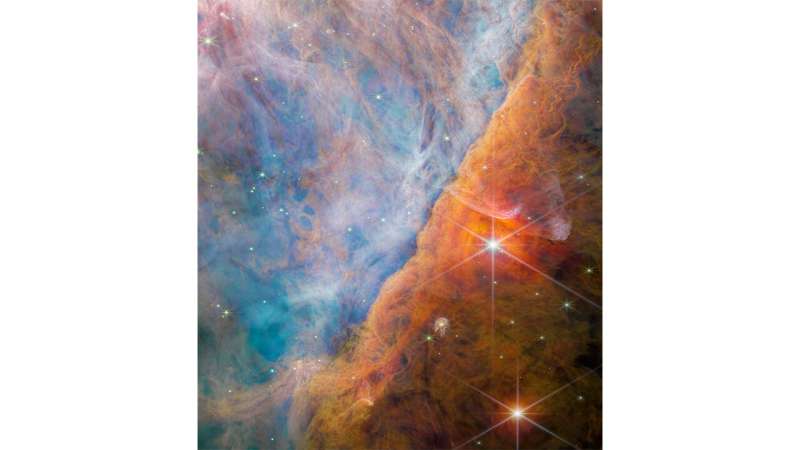
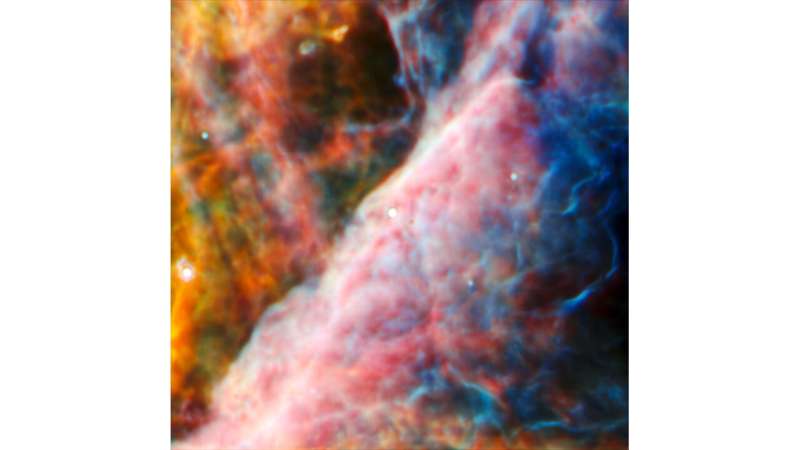
These Webb images show a part of the Orion Nebula known as the Orion Bar. The largest image, on the left, is from Webb's NIRCam (Near-Infrared Camera) instrument. At upper right, the telescope is focused on a smaller area using Webb's MIRI (Mid-Infrared Instrument). At the very center of the MIRI area is a young star system with a protoplanetary disk named d203-506. The pullout at the bottom right displays a combined NIRCam and MIRI image of this young system. Credit: ESA/Webb, NASA, CSA, M. Zamani (ESA/Webb), and the PDRs4All ERS Team
A team of international scientists has used NASA's James Webb Space Telescope to detect a new carbon compound in space for the first time. Known as methyl cation (pronounced cat-eye-on) (CH3+), the molecule is important because it aids the formation of more complex carbon-based molecules. Methyl cation was detected in a young star system, with a protoplanetary disk, known as d203-506, which is located about 1,350 light-years away in the Orion Nebula.
Carbon compounds form the foundations of all known life, and as such are particularly interesting to scientists working to understand both how life developed on Earth, and how it could potentially develop elsewhere in our universe. The study of interstellar organic (carbon-containing) chemistry, which Webb is opening in new ways, is an area of keen fascination to many astronomers.
The unique capabilities of Webb made it an ideal observatory to search for this crucial molecule. Webb's exquisite spatial and spectral resolution, as well as its sensitivity, all contributed to the team's success. In particular, Webb's detection of a series of key emission lines from CH3+ cemented the discovery.
This video features NIRCam’s view of the Orion Bar region studied by the team of astronomers. Bathed in harsh ultraviolet light from the stars of the Trapezium Cluster, it is an area of intense activity, with star formation and active astrochemistry. This made it a perfect place to study the exact impact that ultraviolet radiation has on the molecular makeup of the discs of gas and dust that surround new stars. The radiation erodes the nebula’s gas and dust in a process known as photoevaporation; this creates the rich tapestry of cavities and filaments that fill the view. The radiation also ionises the molecules, causing them to emit light — not only does this create a beautiful vista, it also allows astronomers to study the molecules using the spectrum of their emitted light obtained with Webb’s MIRI and NIRSpec instruments. The two very large, bright stars are two of the three stars in the θ² Orionis system — the Trapezium Cluster is also known as θ¹ Orionis. The brightest star here, θ² Orionis A, is surrounded by particularly bright and red puffs of dust, which are reflecting the star’s light towards Earth. Its great brightness — it is visible with the naked eye — is due to the fact that θ² Orionis A is itself a ternary system made of three closely bound bright stars. Credit: ESA/Webb, NASA, CSA, M. Zamani (ESA/Webb), N. Bartmann (ESA/Webb), O. Berné and the PDRs4All ERS Team, Music: Stellardrone – Twilight
"This detection not only validates the incredible sensitivity of Webb but also confirms the postulated central importance of CH3+ in interstellar chemistry," said Marie-Aline Martin-Drumel of the University of Paris-Saclay in France, a member of the science team. While the star in d203-506 is a small red dwarf, the system is bombarded by strong ultraviolet (UV) light from nearby hot, young, massive stars. Scientists believe that most planet-forming disks go through a period of such intense UV radiation, since stars tend to form in groups that often include massive, UV-producing stars.
This image taken by Webb's NIRCam (Near-Infrared Camera) shows a part of the Orion Nebula known as the Orion Bar. It is a region where energetic ultraviolet light from the Trapezium Cluster—located off the upper-left corner—interacts with dense molecular clouds. The energy of the stellar radiation is slowly eroding the Orion Bar, and this has a profound effect on the molecules and chemistry in the protoplanetary disks that have formed around newborn stars here. Credit: ESA/Webb, NASA, CSA, M. Zamani (ESA/Webb), and the PDRs4All ERS Team
Typically, UV radiation is expected to destroy complex organic molecules, in which case the discovery of CH3+ might seem to be a surprise. However, the team predicts that UV radiation might actually provide the necessary source of energy for CH3+ to form in the first place. Once formed, it then promotes additional chemical reactions to build more complex carbon molecules.
Broadly, the team notes that the molecules they see in d203-506 are quite different from typical protoplanetary disks. In particular, they could not detect any signs of water.
This image from Webb's MIRI (Mid-Infrared Instrument) shows a small region of the Orion Nebula. At the center of this view is a young star system with a protoplanetary disk named d203-506. An international team of astronomers detected a new carbon molecule known as methyl cation for the first time in d203-506. Credit: ESA/Webb, NASA, CSA, M. Zamani (ESA/Webb), and the PDRs4All ERS Team
"This clearly shows that ultraviolet radiation can completely change the chemistry of a protoplanetary disk. It might actually play a critical role in the early chemical stages of the origins of life," elaborated Olivier Berné of the French National Center for Scientific Research in Toulouse, lead author of the study.
More information: Olivier Berné et al, Formation of the Methyl Cation by Photochemistry in a Protoplanetary Disk, Nature (2023). DOI: 10.1038/s41586-023-06307-x
Citation: Webb makes first detection of crucial carbon molecule (2023, June 26) retrieved 26 June 2023 from https://ift.tt/jl91aZv
This document is subject to copyright. Apart from any fair dealing for the purpose of private study or research, no part may be reproduced without the written permission. The content is provided for information purposes only.
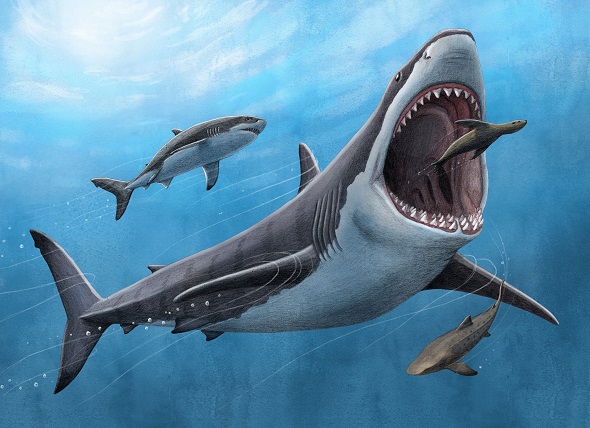
The largest shark alive today, reaching up to 20 meters long, is the whale shark, a sedate filter feeder. As recently as 4 million years ago, however, sharks of that scale likely included the fast-moving predator megalodon, famous for its utterly enormous jaws and correspondingly huge teeth.
Because of incomplete fossil data, we're not entirely sure how large megalodon was and can only make inferences based on some of its living relatives, like the great white and mako sharks. But thanks to some new research on its fossilized teeth, we're now fairly confident that it shared something else with these relatives: it wasn't entirely cold-blooded and apparently kept its body temperature above that of the surrounding ocean.
Taking a temperature
Most sharks, like most fish, are ectothermic, meaning that their body temperatures match those of the surrounding water. But a handful of species, part of a group termed mackerel sharks, have a specialized pattern of blood circulation that helps retain some of the heat their muscles produce. This enables them to keep some body parts at a higher temperature than their surroundings. A species called the salmon shark can maintain a body temperature that's 20° C warmer than the sub-Arctic waters that it occupies.
Megalodon is also a mackerel shark, and some scientists have suggested that it, too, must have been at least partially endothermic to have maintained its growth rates in the varied environments that it inhabited. But, as we mentioned, the megalodon remains we have aren't even sufficient to let us know how large the animal was, much less whether it had the sort of specialized circulatory structure needed for shark endothermy.
So, a team of researchers decided to directly test whether there were signs it regulated its body temperature using things we actually do have: its teeth.
The work relies on a phenomenon known as isotope clumping. If an environment is warm enough, the small weight differences between atomic isotopes don't matter, as the heat is warm enough to thoroughly mix isotopes within a material. But as things cool down, heavier isotopes tend to pool together, forming clumps within a material. We now have equipment that can track the distribution of isotopes within a material at high resolution, allowing a direct measure of its clumpiness. That, in turn, can be used to generate an estimate of the temperature at which the material formed.
The new work relied on fossil beds that contained at least three distinct types of fossils. One was obviously megalodon teeth. But the others were needed to provide some degree of outside reference for the estimates obtained from the sharks. These include the bones of known cold-blooded fish, which provided a baseline for the environmental temperatures. They also obtained samples of the ear bones of whales to have a known warm-blooded control. Critically, they obtained these samples from widely distributed sites in the Atlantic and Pacific Oceans, ensuring that any differences weren't simply a matter of local environmental conditions.
Heat up, move fast
The samples of ectotherms showed the sorts of regional variations you'd expect from seawater temperatures, with estimates ranging from a low of 17° C in California to a high of 23° C in the Mediterranean. The megalodon samples, in contrast, were consistently warmer, with an average temperature difference of about 7° C compared to the cold-blooded samples.
This isn't as warm as the whale samples. But, as the researchers point out, the whale samples came from their inner ears, which are fairly removed from the environment, and so likely to reflect the animal's internal temperature. In sharks, in contrast, the teeth are relatively exposed to the environment and so may be intermediate between the typical body temperature and that of the outside world. The temperature of mackerel sharks also tends to vary across different body parts.
So why might an elevated body temperature have been selected for in megalodon? There are two potential reasons. One is, as noted above, that the temperatures might have been essential to maintain the growth rates needed to allow something as big as megalodon to develop in non-tropic environments. The second is speed. Warm muscles could be necessary to power the animal through the water quickly enough to be an effective predator. The mako shark, for example, is the fastest shark and partly endothermic.
Megalodon's large body size might have also made heat retention somewhat easier, as it increases the ratio of body volume to surface area, meaning there's less surface to lose heat compared to the amount of muscle generating it.
The authors of the new paper, however, suggest that might also have left megalodon vulnerable to climate change. The high metabolic demands involved in maintaining its endothermy could have made megalodon sensitive to changes in the ecosystem. And, near the time of its extinction, the Earth generally got cooler, causing sea levels to fall, which would have disrupted coastal ecosystems. And megalodon seems to have relied on coastal nurseries during its early years.
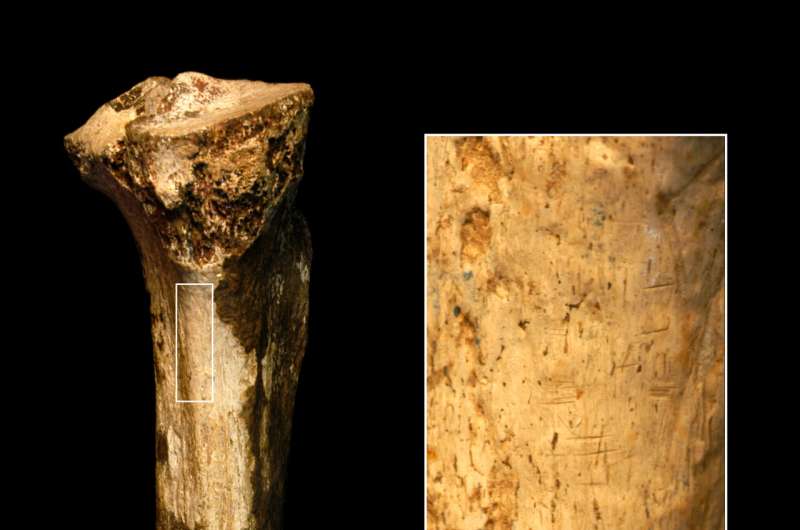
View of the hominin tibia and magnified area that shows cut marks. Scale = 4 cm. Credit: Jennifer Clark.
Researchers from the Smithsonian's National Museum of Natural History have identified the oldest decisive evidence of humans' close evolutionary relatives butchering and likely eating one another.
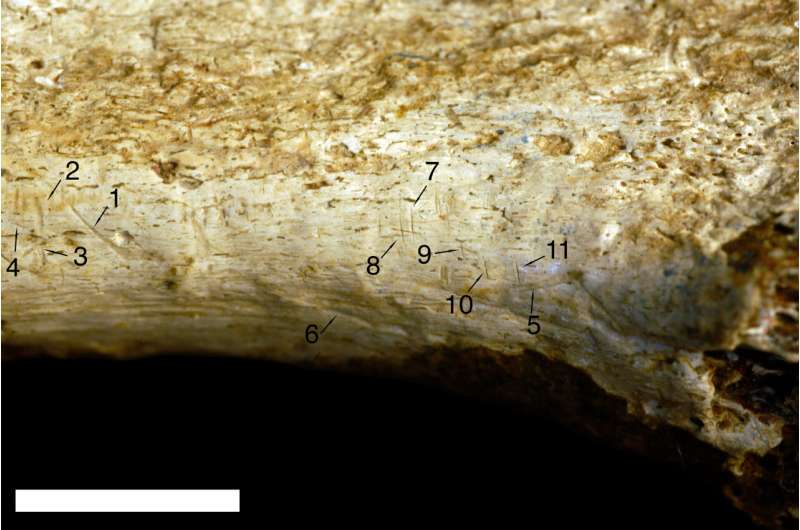
In a new study published June 26, in Scientific Reports, National Museum of Natural History paleoanthropologist Briana Pobiner and her co-authors describe nine cut marks on a 1.45 million-year-old left shin bone from a relative of Homo sapiens found in northern Kenya. Analysis of 3D models of the fossil's surface revealed that the cut marks were dead ringers for the damage inflicted by stone tools. This is the oldest instance of this behavior known with a high degree of confidence and specificity.
"The information we have tells us that hominins were likely eating other hominins at least 1.45 million years ago," Pobiner said. "There are numerous other examples of species from the human evolutionary tree consuming each other for nutrition, but this fossil suggests that our species' relatives were eating each other to survive further into the past than we recognized."
Pobiner first encountered the fossilized tibia, or shin bone, in the collections of the National Museums of Kenya's Nairobi National Museum while looking for clues about which prehistoric predators might have been hunting and eating humans' ancient relatives. With a handheld magnifying lens, Pobiner pored over the tibia looking for bite marks from extinct beasts when she instead noticed what immediately looked to her like evidence of butchery.
Nine marks identified as cut marks (mark numbers 1–4 and 7–11) and two identified as tooth marks (mark numbers 5 and 6) based on comparison with 898 known bone surface modifications. Scale = 1 cm. Credit: Jennifer Clark.
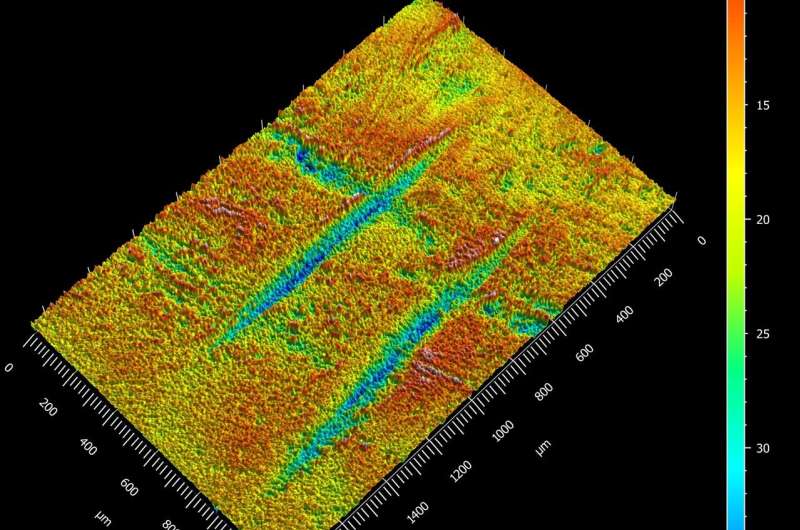
To figure out if what she was seeing on the surface of this fossil were indeed cut marks, Pobiner sent molds of the cuts—made with the same material dentists use to create impressions of teeth—to co-author Michael Pante of Colorado State University. She provided Pante with no details about what he was being sent, simply asking him to analyze the marks on the molds and tell her what made them. Pante created 3D scans of the molds and compared the shape of the marks to a database of 898 individual tooth, butchery and trample marks created through controlled experiments.
The analysis positively identified nine of the 11 marks as clear matches for the type of damage inflicted by stone tools. The other two marks were likely bite marks from a big cat, with a lion being the closest match. According to Pobiner, the bite marks could have come from one of the three different types of saber-tooth cats prowling the landscape at the time the owner of this shin bone was alive.
By themselves, the cut marks do not prove that the human relative who inflicted them also made a meal out of the leg, but Pobiner said this seems to be the most likely scenario. She explained that the cut marks are located where a calf muscle would have attached to the bone—a good place to cut if the goal is to remove a chunk of flesh. The cut marks are also all oriented the same way, such that a hand wielding a stone tool could have made them all in succession without changing grip or adjusting the angle of attack.
"These cut marks look very similar to what I've seen on animal fossils that were being processed for consumption," Pobiner said. "It seems most likely that the meat from this leg was eaten and that it was eaten for nutrition as opposed to for a ritual."
3D model of marks 7 and 8 identified as cut marks. Credit: Michael Pante.
While this case may appear to be cannibalism to a casual observer, Pobiner said there is not enough evidence to make that determination because cannibalism requires that the eater and the eaten hail from the same species.
The fossil shin bone was initially identified as Australopithecus boisei and then in 1990 as Homo erectus, but today, experts agree that there is not enough information to assign the specimen to a particular species of hominin. The use of stone tools also does not narrow down which species might have been doing the cutting. Recent research from Rick Potts, the National Museum of Natural History's Peter Buck Chair of Human Origins, further called into question the once-common assumption that only one genus, Homo, made and used stone tools.
So, this fossil could be a trace of prehistoric cannibalism, but it is also possible this was a case of one species chowing down on its evolutionary cousin.
None of the stone-tool cut marks overlap with the two bite marks, which makes it hard to infer anything about the order of events that took place. For instance, a big cat may have scavenged the remains after hominins removed most of the meat from the leg bone. It is equally possible that a big cat killed an unlucky hominin and then was chased off or scurried away before opportunistic hominins took over the kill.
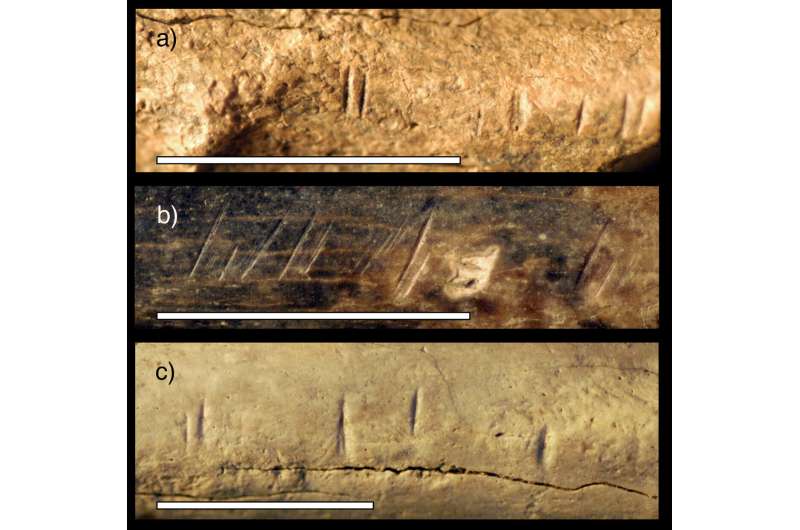
Close-up photos of three fossil animal specimens from the same area and time horizon as the fossil hominin tibia studied by the research team. These fossils show similar cut marks to those found on the hominin tibia studied. The photos show (a) an antelope mandible, (b) an antelope radius (lower front leg bone) and (c) a large mammal scapula (shoulder blade). Credit: Briana Pobiner.
One other fossil—a skull first found in South Africa in 1976—has previously sparked debate about the earliest known case of human relatives butchering each other. Estimates for the age of this skull range from 1.5 to 2.6 million years old.
Apart from its uncertain age, two studies that have examined the fossil (the first published in 2000 and the latter in 2018) disagree about the origin of marks just below the skull's right cheek bone. One contends the marks resulted from stone tools wielded by hominin relatives and the other asserts that they were formed through contact with sharp-edged stone blocks found lying against the skull. Further, even if ancient hominins produced the marks, it is not clear whether they were butchering each other for food, given the lack of large muscle groups on the skull.
To resolve the issue of whether the fossil tibia she and her colleagues studied is indeed the oldest cut-marked hominin fossil, Pobiner said she would love to reexamine the skull from South Africa, which is claimed to have cut marks using the same techniques observed in the present study.
She also said this new shocking finding is proof of the value of museum collections.
"You can make some pretty amazing discoveries by going back into museum collections and taking a second look at fossils," Pobiner said. "Not everyone sees everything the first time around. It takes a community of scientists coming in with different questions and techniques to keep expanding our knowledge of the world."
More information: Early Pleistocene cut marked hominin fossil from Koobi Fora, Kenya, Scientific Reports (2023). DOI: 10.1038/s41598-023-35702-7
Citation: Humans' evolutionary relatives butchered one another 1.45 million years ago (2023, June 26) retrieved 26 June 2023 from https://ift.tt/oUuyQ7l
This document is subject to copyright. Apart from any fair dealing for the purpose of private study or research, no part may be reproduced without the written permission. The content is provided for information purposes only.
NEW YORK CITY—Amidst rock music, a rapabout consciousness, and the calling in of a 25-year-old drunken bet, camps backing two leading theories of how consciousness arises from the brain waited anxiously in a Greenwich village theater on Friday to hear who had won the first round of an ambitious “adversarial collaboration.” Three neutral judges chosen to help design the experiment and evaluate the results gave a qualified victory to advocates of the idea that consciousness is a feature of networks of neurons found at the back of the brain.
But the opposing camp is far from ready to concede. It still contends that consciousness emerges within the brain’s “executive” center, the prefrontal cortex. “The results ended up challenging both [groups], with key predictions of the two theories being disconfirmed by the data,” says Liad Mudrik, a cognitive neuroscientist at Tel Aviv University and one of the judges of the scientific showdown.
The unusual evening event, part of the annual meeting of the Association for the Scientific Study of Consciousness (ASSC), also served as the denouement of a wager placed in 1998 at the second such conference. There, cognitive neuroscientist Christof Koch bet philosopher David Chalmers that the neural correlates of consciousness would be nailed down in 25 years. Drawing on the new experimental results, Koch yesterday conceded that those correlates remain unclear and on a stage gallantly offered up a bottle of 1978 Madeira to Chalmers, with five more fine reds in the wings.
David Chalmers (left) accepting the spoils of his consciousness bet with Christof Koch
For the collaboration, funded by the Templeton World Charity Foundation (TWCF), both sides of the consciousness debate agreed on experiments to be conducted by “theory-neutral” labs with no stake in the outcome. It pits Integrated Information Theory (IIT), the sensory network hypothesis that proposes a posterior “hot zone” as the site of consciousness, against the Global Neuronal Workspace Theory (GNWT), which likens networks of neurons in the front of the brain to a clipboard where sensory signals, thoughts and memories combine before being broadcast across the brain.
On balance, the three judges assessing the initial experiments gave more points to IIT, and its advocates were ready to declare victory.“The results corroborate IIT’s overall claim that posterior cortical areas are sufficient for consciousness, and neither the involvement of [the prefrontal cortex] nor global broadcasting are necessary,” said Melanie Boly, a neurologist and neuroscientist at the University of Wisconsin and a leading proponent of IIT.
But GNWT’sstoic chief architect, Stanislas Dehaene, Director of the INSERM-CEA Cognitive Neuroimaging Unit in Orsay, France, believes the this experimental round had limitations and the results of other tests in the adversarial collaboration–still to be announced–will support the role of theprefrontal cortex.He adds thatthe new findings locating conscious perception to the back of the brain are predicted by lots of theories, and don't confirm the specifics of IIT.
Consciousness has compelled philosophers since Plato, but over the last three decades, neuroscientists have entered the fray. Both disciplines seek a working theory of consciousness as the first step towards measuring the phenomenon–whether to make life and death decisions about brain-damaged patients, ascribe rights to animals or determine whether AI may have it.
Among dozens of theories of consciousness, GNWT and IIT are among the most widely discussed. GNWT gained initial support from experiments that asked participants to report the moment they became aware of a stimulus, such as an image flashing on a screen. In those studies, many of them led by Dehaene, brain scans showed that the prefrontal cortex lit up at the moment of perception.
But philosophers and experimentalists questioned whether these studies captured the neural markers of conscious perception, or simply the task of reporting it. Cognitive processes such as paying attention and storing information in memory, both of which enable participants to respond that they’ve seen an image, are known to take place in the prefrontal cortex.
"No-report” studies, where participants passively view images, seemed to offer a workaround. A popular one involves binocular rivalry: if different images are shown to a person’s left and right eye, their conscious perception flips between them. These flips can be monitored—independent of participants’ report—by tracking eye movements. And lo, these experiments found signals of conscious perception at the back of the brain, the area predicted by IIT.
The front-of-brain camp fought back, arguing that these studies were themselves rife with confounders. For example, participants might be so wearied by staring at onscreen images that they stop paying attention to them and let their mind wander to other tasks, a phenomenon that New York University philosopher Ned Block dubbed the “bored monkey problem.”
It was this cauldron of contested evidence that fueled the adversarial collaboration. The project,launched in 2019, was the brainchild ofKoch, then chief scientistat the Allen Institute and a proponent of IIT, and Dawid Potgieter, director of Discovery Science programs at TWCF, which committed 20 million dollars to a series ofgrantsfor adversarial collaborations testing theories of consciousness.
For the GNWT-versus-IIT phase of the project,Mudrik and the two other judges, psychologists Lucia Melloni at Max Planck Institute and Michael Pitts at Reed College spent a year working closely withDehaeneand Giulio Tononi, a psychiatrist and neuroscientist at the University of Wisconsin and chief architect of IIT, to design two experiments for which each theory offered clearly distinct predictions. Dehaene and Tononi would have no role in performing the experiments or writing up the results.
The teampreregistered the experimental designon an open science website andpublished the detailslast February. Sixtheory-neutral labs would scan the brains of 250 total participants using threetechniques: functional magnetic resonance imaging,magnetoencephalography, andelectrocorticography, in which electrodes are placed on the brain’s surface prior to a surgery.
The first of the two planned experimentsshowed participants images with and without an accompanying task—pressinga button in response to either of two target pictures—so researchers could look for differences in the resulting brain signals. IIT predicts that passive perception will activate the back of the brain, but perception while performing tasks will spark the front. GNWT predicts similar brain activation in the two situations.
Key to the experiment were algorithms called multivariate pattern decoders, which could predict which image a participant was viewing at a given time based on their brain signals. Researchers initially “trained” these decoders by feeding them examples of that participant’s brain activity data along with the corresponding image.
GNWTpredicts that the frontal networks supporting both active and passive perception should be similar enough to allow the decoder to cross train. That is, if it’s been trained only on signals related to the task of passively observing a face, it should still be able to decode data from the task of pressing a button in response to a face. IIT predicts that cross training will only work well with brain signals from the posterior regions, the proposed site of conscious perception.
And that’s largely what the researchers found: outside of posterior regions, the decoders were not consistently able to switch between the tasked and passive data sets—a result that favors IIT.
But in another analysis, the tables were turned. During conscious perception, IIT predicts neural communication within posterior areas, while GNWT predicts it should be between visual and frontal zones. And in the study, "the expected communication patterns were in line with GNWT,” says Mudrik.
The timing of the recorded signals, meanwhile, offered stronger support for IIT. In the posterior region, activity persisted as long as the image was presented onscreen, as IIT predicts. GNWT instead predicts an initial spike of activity—the “ignition” of the frontal workspace—and another spike when the stimulus disappears. That theory scored a partial win: there was evidence for an initial spike, but not the “off” spike.
Dehaene says the design of the experiment compromised the sensitivity of signal decoding from the front of the brain that would have supported GNWT. It was, he says, a design that Tononi was keen on. In a trade-off, Dahaene scored his preferred design for the subsequent TWCF-funded experiment, which the research team hopes to present at next year’s ASSC meeting. Using a customized video game to distract participants, this experiment will isolate neural signals of conscious perception by comparing brain signals when subjects are aware of seeing an image and when they’re not.
Although Koch's favored theory now has a leg up on GNWT, he says the continuing doubts around the new results were enough to pay off the bet to Chalmers. “I’ve lost the battle,” he declared onstage, “but won the war for science.”
On Sept. 1, 1859, British astronomer Richard Carrington was investigating a strange cluster of dark blobs in the sun's atmosphere when a bright blast of light caught his eye. Shining for nearly five minutes, the flash would later make history as the first recorded solar flare ever observed — but Carrington's name would ultimately become synonymous with the violent solar storm that slammed into Earth less than 48 hours later.
Now called the Carrington Event, the speeding storm of electrically charged particles caused telegraph offices to go up in flames and triggered colorful auroras as far south as Cuba and Hawaii. To this day, the Carrington Event is considered the most intense solar storm in recorded history. And those dark blobs that Carrington was studying — vast, planet-size regions of pent-up magnetic energy called sunspots — could have provided a big clue that something nasty was on its way.
Unbeknownst to Carrington but well understood by modern astronomers, the size and quantity of sunspots visible at a given moment tie directly to the sun's 11-year cycle of electromagnetic activity. When more and bigger sunspots are visible, the sun is usually building toward the peak of its cycle, known as the solar maximum. As the maximum approaches, solar weather phenomena such as solar flares and coronal mass ejections (CMEs) — enormous blobs of plasma that speed across space and trigger storms like the Carrington Event upon colliding with Earth's atmosphere — become more common as well.
We don't have to guess what the sun looked like before the Carrington Event; Carrington himself sketched a diagram of the sunspots he saw facing Earth and later submitted the drawings to the journal Monthly Notices of the Royal Astronomical Society. The images show a large grouping of dark blobs that Carrington estimated to be collectively as wide as Jupiter; a 2019 reanalysis of his sketches published in the journal Space Weather estimated that the spots spanned between 9% and 14% of the solar disk's width.
SpaceWeather.com created this composite image of Carrington's sunspot (above) and the largest sunspot in modern history (below), from 2003. The two spots are roughly equal in size.(Image credit: Richard Carrington / NASA / SpaceWeather.com)
That's huge for a group of sunspots, but it's not unheard of. According to Spaceweather.com, scientists observed a sunspot of roughly equal size in November 2003, right before the strongest solar flare in the modern era flashed to life. (Fortunately, the resulting CME only skimmed Earth and did not result in widespread damage.) For a sense of scale, Spaceweather edited Carrington's sunspot sketches into a satellite image of the 2003 sunspot, to show the two monsters side by side.
Sunspot activity has increased dramatically in early 2023, with sunspot numbers far exceeding NASA's predictions each month — though nothing as big as Carrington’s sunspots have been seen yet. Still, the profusion of sunspots and other solar weather suggests that the next solar maximum will arrive sooner and stronger than NASA previously predicted. Whether the incoming maximum brings with it a Carrington-level storm is a matter of pure chance — but scientists will keep watching for spotty signs on the sun, just in case.
Article From & Read More ( See the 'monster' sunspot that launched the Carrington Event, the most devastating solar storm in recorded history - Livescience.com )
https://ift.tt/gWaQnzA
Science
Some days NASA sees the Red Planet, and it wants to paint it rainbow colors.
In these new images of Mars, the planet's rusty crust takes on strange, psychedelic hues. The global photos were taken by the space agency's Maven mission(opens in a new tab), shorthand for "Mars atmosphere and volatile evolution."
Rendered in ultraviolet wavelengths so the data is easier to perceive visually, the atmosphere's ozone appears splashed in Kool-aid Purplesaurus Rex, and Martian clouds and hazes look like a frothy cappuccino foam or antifreeze blue. And that signature red surface, caused by heavy doses of oxidized iron in the ground? More like khaki or verde marble.
This isn't random eye candy for space lovers. Scientists can learn valuable information about Mars' atmosphere by studying it through this lens.
Maven's Imaging Ultraviolet Spectrograph instrument measures wavelengths of light invisible to human eyes. Astronomers use this data to determine how the loss of volatiles from the Martian atmosphere(opens in a new tab) — molecules such as water and carbon dioxide that easily evaporate — has affected the planet's climate over the ages. These molecules got thrown into the atmosphere from Mars' interior and crust through volcanic plumes.
NASA's Maven captures Mars in ultraviolet in July 2022.Credit: NASA / LASP / CU Boulder
In the first image, taken during the southern hemisphere's summer, the Argyre Basin, at the bottom left, is filled with rosé pink, indicating atmospheric haze. At the top left of the planet, Valles Marineris, a canyon system longer than the United States, appears tan because it's filled with clouds. The southern polar ice cap at the bottom is stark white, but shrinking from the warmer weather.
"Southern summer warming and dust storms drive water vapor to very high altitudes," the agency said(opens in a new tab), bolstering MAVEN's previous discovery of greater hydrogen loss from the planet during this time of year.
NASA's Maven captures Mars in ultraviolet in January 2023.Credit: NASA / LASP / CU Boulder
The second image shows just how much the atmosphere changes with the seasons. The northern polar region appears white, chock full of clouds, and Valles Marineris, now in the lower left, remains tan along with lots of craters.
"Ozone, which appears magenta in this UV view, has built up during the northern winter’s chilly polar nights," according to NASA(opens in a new tab). "It is then destroyed in northern spring by chemical reactions with water vapor, which is restricted to low altitudes of the atmosphere at this time of year."
The Maven mission, planned to last two years, has now studied Mars for nearly a decade. The orbiter has enough fuel to operate through 2030.
The news this week was dominated by the search for the OceanGate Titan submersible, which went missing during its descent to the wreckage of the Titanic. Tragically, the U.S. Coast Guard confirmed that debris found near the sunken ocean liner was part of the lost sub, and that it suffered a "catastrophic implosion," killing the five men inside.
Elsewhere, there was plenty of science to exercise your brain cells this week. There was the exciting discovery of an exotic new state of matter made of particles called excitons; extraordinary research looking at the cosmological constant problem, which suggests the expansion of the universe could be an illusion; and the discovery that your brain itself is filled with mysterious spiral signals that could be key to our cognition.
Far more tangibly, we learnt of the tallest tree in Asia, which stands at an astonishing 335 feet (102 meters) tall, and an anatomically accurate, 42,00-year-old penis pendant — the world's earliest known depiction of human genitalia.
At Live Science, we’re dedicated to bringing you the latest science news with clarity, authority and humor, and this is just a taste of the stories we have to offer. Be sure to visit the site daily to stay updated, follow us on Facebook, Twitter and Instagram, and sign up to our daily newsletter using the form below.
Picture of the week
A time-lapse image of lightning bolts from a thunderstorm near Mudanya in Turkey on June 16. (Image credit: Uğur İkizler)
This striking time-lapse photo of more than 100 individual lightning bolts was taken during a fierce thunderstorm in Turkey. At least three different types of lightning are visible — cloud-to-cloud, where the bolt begins and ends in the clouds; cloud-to-ground, where the bolt hits the ground; and cloud-to-water, where the bolts strike the water.
Astrophotographer Uğur İkizler created the electrifying image by combining individual shots collected over a 50-minute period, with a lightning strike happening every 30 seconds on average.
"Each and every one of them is beautiful, but when I combined all the lightning bolts into a single frame, it was a frightening sight," İkizler told Live Science in an email. The thunderstorm was a "magnificent visual feast," he added.
A close-up image of the sun with a halo of plasma spinning around the star's north pole(Image credit: NASA/ Solar Dynamics Observatory)
From here on Earth, the sun may seem calm and steady, but our home star is in a perpetual state of flux, transforming over time from a uniform sea of fire to a chaotic jumble of warped plasma and back in a recurring 11-year cycle.
During this cycle, the sun's magnetic field gets tangled up like a ball of tightly wound rubber bands until it eventually snaps, turning the star's north pole into the south pole in the process. The lead-up to this gargantuan reversal is a period known as the solar maximum and is filled with rising sunspot numbers, bizarre plasma structures and enormous solar storms. It is a potentially perilous time for Earth, which gets bombarded by solar storms that can disrupt communications systems, damage power infrastructure and send satellites plummeting toward the planet.